Being Honest About Packet Capture Failures


The Akita CLI provides the commands `akita learn` and `akita apidump` for creating API traces by observing network traffic. We describe some of the work that went into this functionality in a previous blog entry about how we use GoPacket.
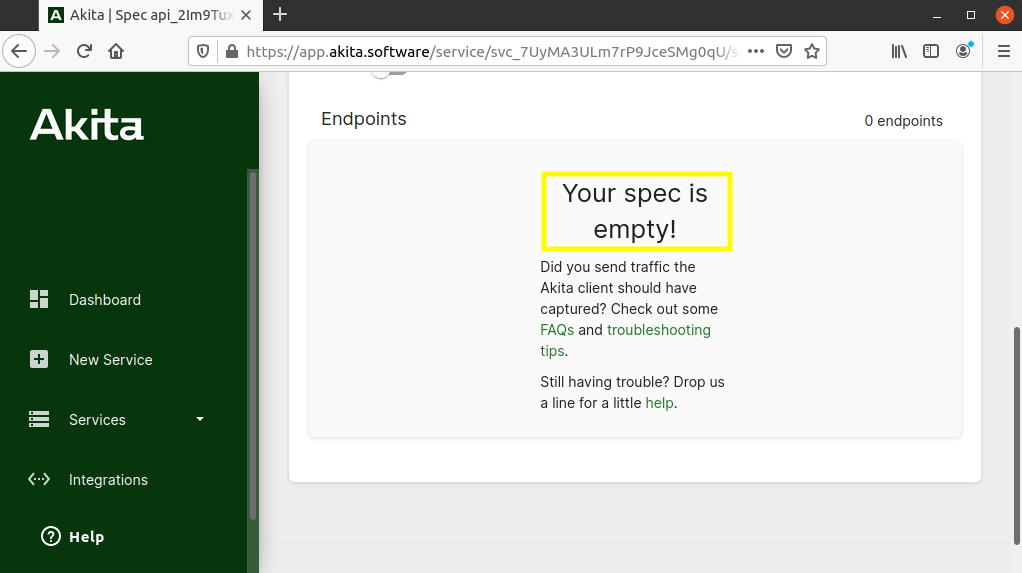
But, this tool had a problem: it happily reported success, even when an API trace was completely empty:


I ran into this while testing out onboarding. Akita users ran into this while trying Akita out for the first time. Oops. We needed to do better.
The Akita agent works by passively monitoring API traffic, so that we don’t need to be on the data path or add any performance overhead. But the trade-off is that pointing Akita at the right traffic can be error-prone. In this post, I’ll talk about the latest addition to our CLI: network diagnostics to help with a smoother Akita setup experience.
Understanding the Causes of Failure
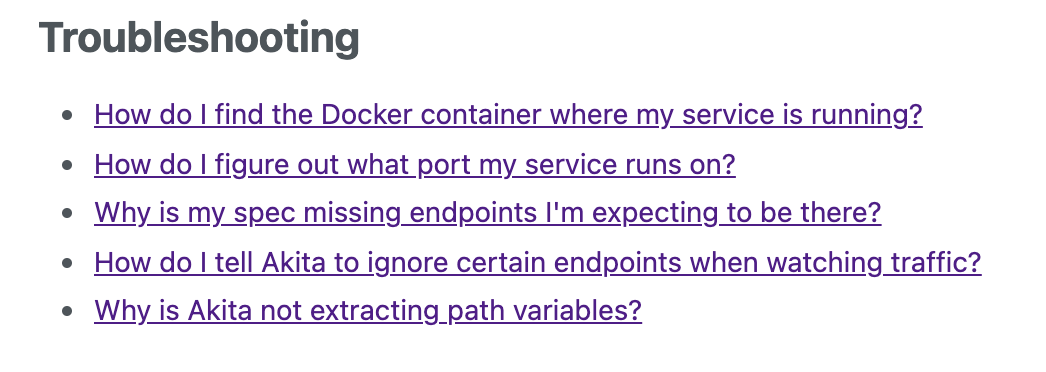
One approach is to give people a checklist: did you try X? Can you run it like Y? What does Z look like? That had been the Akita approach up to now:

I strongly believe that if these diagnostic steps are simple enough, the tool should perform them on the user’s behalf. If the steps are low-cost, the tool should do them all the time so that the very first failure comes with an explanation.
My first action in designing for diagnostics was trying to understand what might go wrong, based on user questions and bug reports, as well as my experience with past failures. Here’s my list of reasons we might get an empty or incomplete trace:
- There might not be any API traffic to capture.
- The API traffic might exist, but on a different port or interface than the user told the Akita CLI to use.
- The API traffic might be HTTPS, which we can’t parse, because it is encrypted end-to-end. There are some techniques which we recommend for capturing an API trace anyway; see Browser for Client-Side Traffic or Proxy for Encrypted Traffic in our documentation. Or it might even be a more exotic protocol like QUIC which the tool can’t handle yet.
- The networking configuration on a host might allow us to see only part of the traffic, such as inbound traffic but not outbound traffic.
- There might be an error value from the packet capture code. But most of the things that go wrong happen right away. For example, the user might lack the correct permissions to start a packet capture. Without more clarity about the errors that come back, the best we can do (for now) is show them. Once we know their causes, we can come back and improve the code.
The easiest way to get a handle on these causes is to start counting how many packets we’ve seen. Did we see any traffic at all? Did we see traffic matching what the user asked us for, but fail to parse it? With that data in hand, we can try to connect to one of these root causes and inform the user. This is the same procedure I would follow if diagnosing a customer problem; the tool can automatically take at least the first few steps.
Explaining the Failure
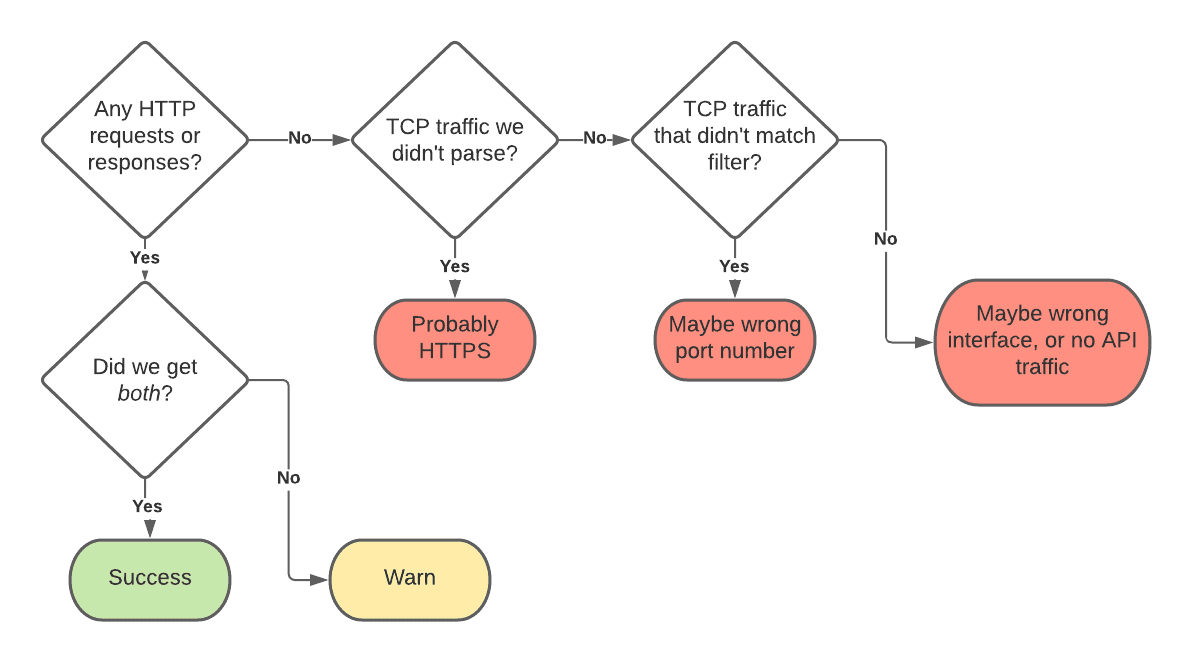
Here’s a decision tree, based on the ideas above about what might have gone wrong. In this section, I’ll show how I tried to give more informative feedback about each of the failure cases I identified.

The biggest improvement is simply not reporting success when the trace is empty.

But, the packet counters we collect during the trace operation (described in the next section) let us guide the user toward the right solution.
Even if we did successfully capture some HTTP calls, it might be that the balance is uneven. For now, I didn’t try to report on that—it seems vulnerable to false positives—but the special case when there are zero requests, or zero responses, seems worth at least a warning. The CLI uploads the trace anyway when this occurs.
When we see TCP traffic matching the user’s requested port (or other BPF filter) it’s probably the API traffic they wanted us to capture. But, if we can’t parse it, the most likely explanation is that it’s HTTPS instead of HTTP. We could be certain by looking for TLS handshake messages, but that didn’t make the first cut. The client gives the affirmative feedback that it did see traffic, it just couldn’t understand it, with the links given above also provided inline in the output:

If we didn’t see the traffic that the user asked us to trace, things become less clear. Maybe we saw some traffic, but on a different port. That at least tells the user that there’s something happening, but maybe not what they expected.

Or, it might be that nothing was observed at all. This is rare, as most systems have some sort of network traffic going on. It might indicate that the API client was listening on the wrong interface (although Akita attempts to trace all interfaces by default.)

You can see the code in the akita-cli repository here.
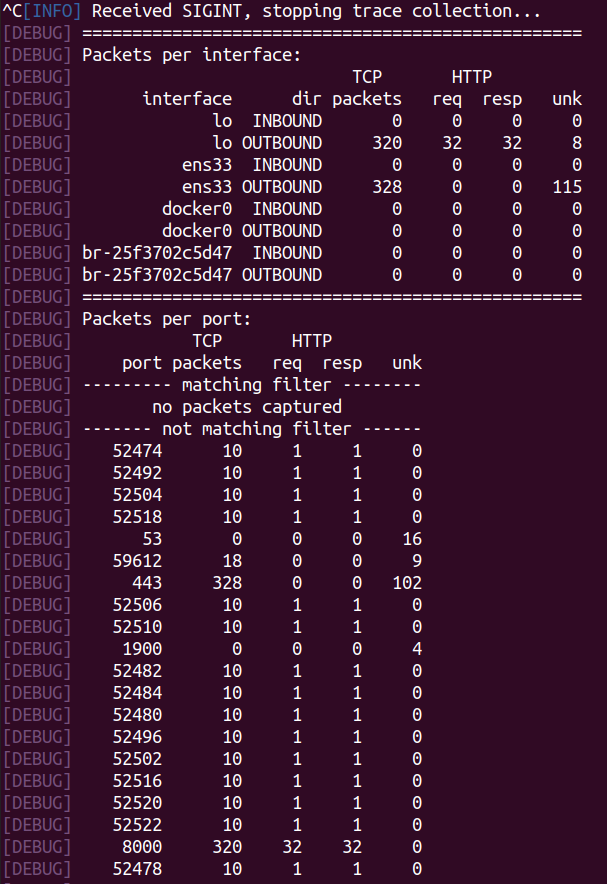
If these summaries are not enough to resolve the problem, the CLI also has a “debug mode” (accessible via `--debug`) that shows information about every packet that is captured, as well as a summary at the end:

This information is subject to change in later versions. It currently shows how many TCP packets were captured on each interface, the number of HTTP requests and responses, and the number of unknown (non-HTTP) packets. The same information is broken down by port number, which may allow a user to see the port number actually in use—though there are probably better ways of getting this information, such as `lsof` or `netstat` to see listening TCP sockets. I am still trying to figure out more user-friendly ways to automate these parts of the debugging process, so let me know if you have ideas. 😊
Instrumenting Packet Capture
To make our way through the decision tree, and give appropriate feedback, we need a compact record of what network traffic we’ve seen. I instrumented our packet capture code (described in Programmatically Analyze Packet Captures with gopacket) with a simple, reliable, old-school network monitoring technique: counters!
I defined a new structure that we’ll use for counting packets and protocol units; it can be expanded later for more counters of interest:
I also defined a simple interface that collects “deltas” to the counters, using the same type:
Every time the client sees a reconstructed portion of a TCP stream, we categorize it as an HTTP request, an HTTP response, or something not included in the trace:
Go’s conventions ensure that all the counts I didn’t specify are zeros.
I also installed a callback function which operates on every packet we receive from the gopacket library, and counts those that are TCP packets.
One such callback function is installed per interface, so that we get per-interface counts.
These are not the only measurements we could take. For example, we could recognize HTTPS handshakes and flag them as a separate count. We could collect spans and individual events instead of just counters. But this is enough to solve some immediate usability problems.
Conclusion: Building Diagnostics and Explanations into Tools
Too often, software fails without any attempt to explain where it went wrong. Or, worse, software reports success when a self-diagnostic check would indicate that there is a problem!
Reporting a code-level error message is not enough. That might be sufficient for a developer to track down the branch that the code went down. Or it might allow a user to look up the message on StackOverflow—though I have had the experience of finding my exact error message on a two-year old question with no answer! Too often the first step is “can you do it again” or “try it with debug flags on” or “run this other check”. An observability tool, in particular, should make its own observations and report its own conclusions. It might be the only tool installed in a container, or other restricted environment.
My list of the things that can go wrong with a packet trace, and the symptoms the code checks, are by no means exhaustive. But we owe it to our users to get at least the easy cases right, by giving users evidence and actionable advice. I’d love to have you try out our beta and let me know if you have thoughts about improving our error reporting!
With thanks to Nelson Elhage and Jean Yang for comments. Photo by Kind and Curious on Unsplash.


